Epimap - Visualize more than 100.000 latin inscriptions in space and time (1000BC to 1000AC)
Choose a time range and a textual filter, and visualize how latin engravings appeared, spread and disappeared through the ages, using a wide range of analysis tools (density maps, 2D histograms, entropy, average distance, clusters, ...). You can also download the raw data in a .csv format.

Epimap - Visualize more than 100.000 latin inscriptions in space and time (1000BC to 1000AC)

2020, Oct 14    

Link to the paper

Try it yourself HERE!

Choose a time range and a textual filter, and visualize how latin engravings appeared, spread and disappeared through the ages, using a wide range of analysis tools (density maps, 2D histograms, entropy, average distance, clusters, …). You can also download the raw data in a .csv format.

Here are some examples.
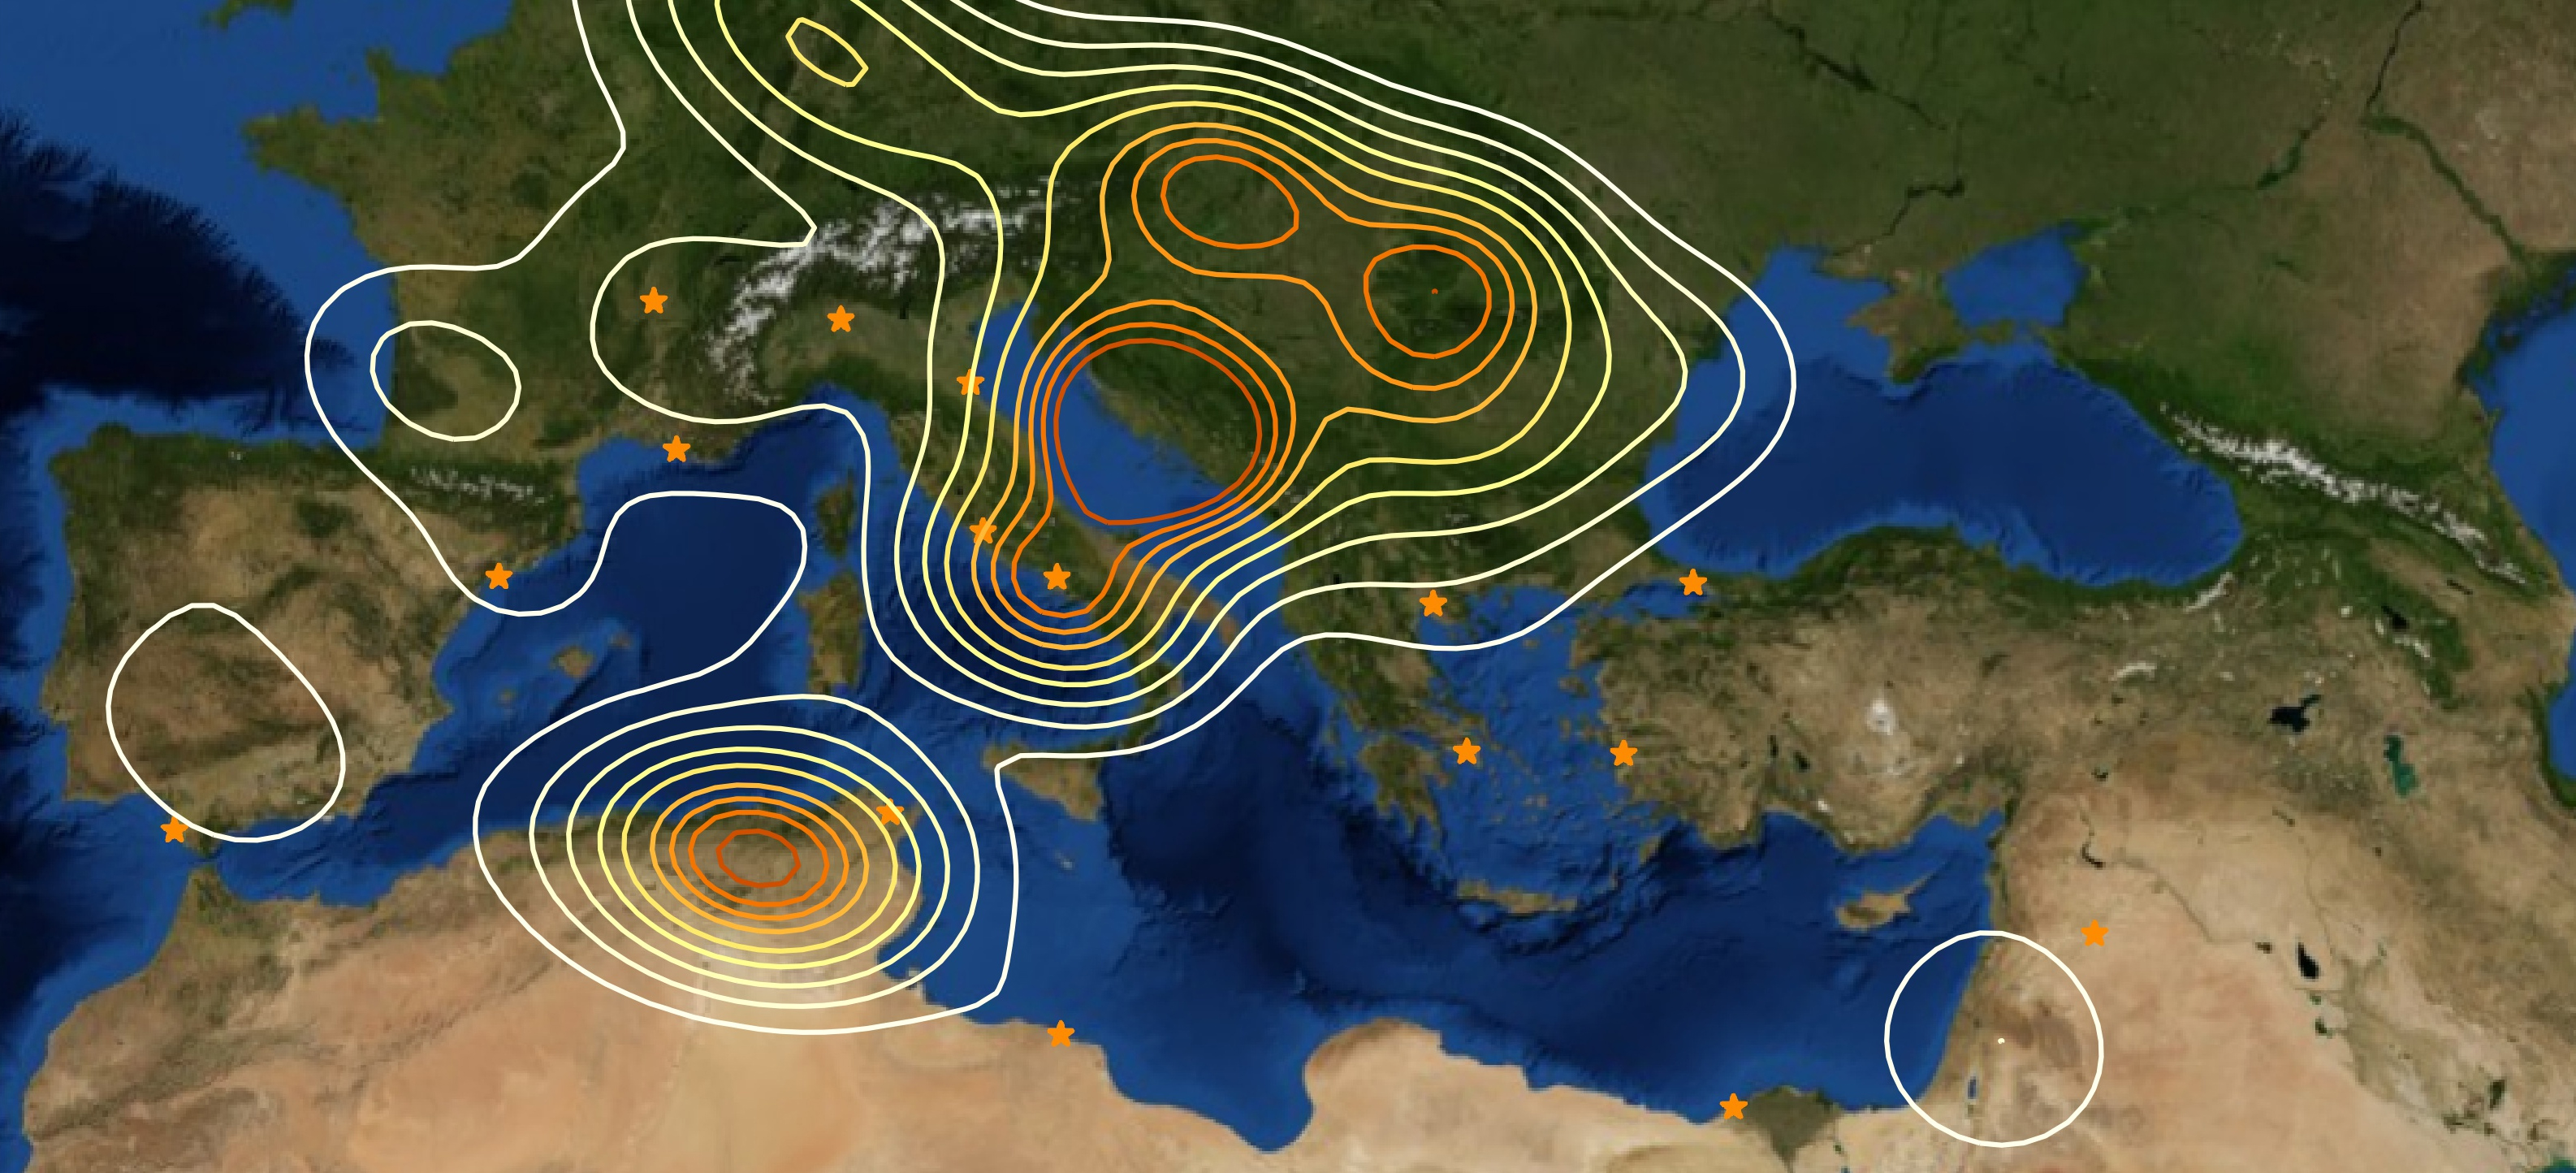
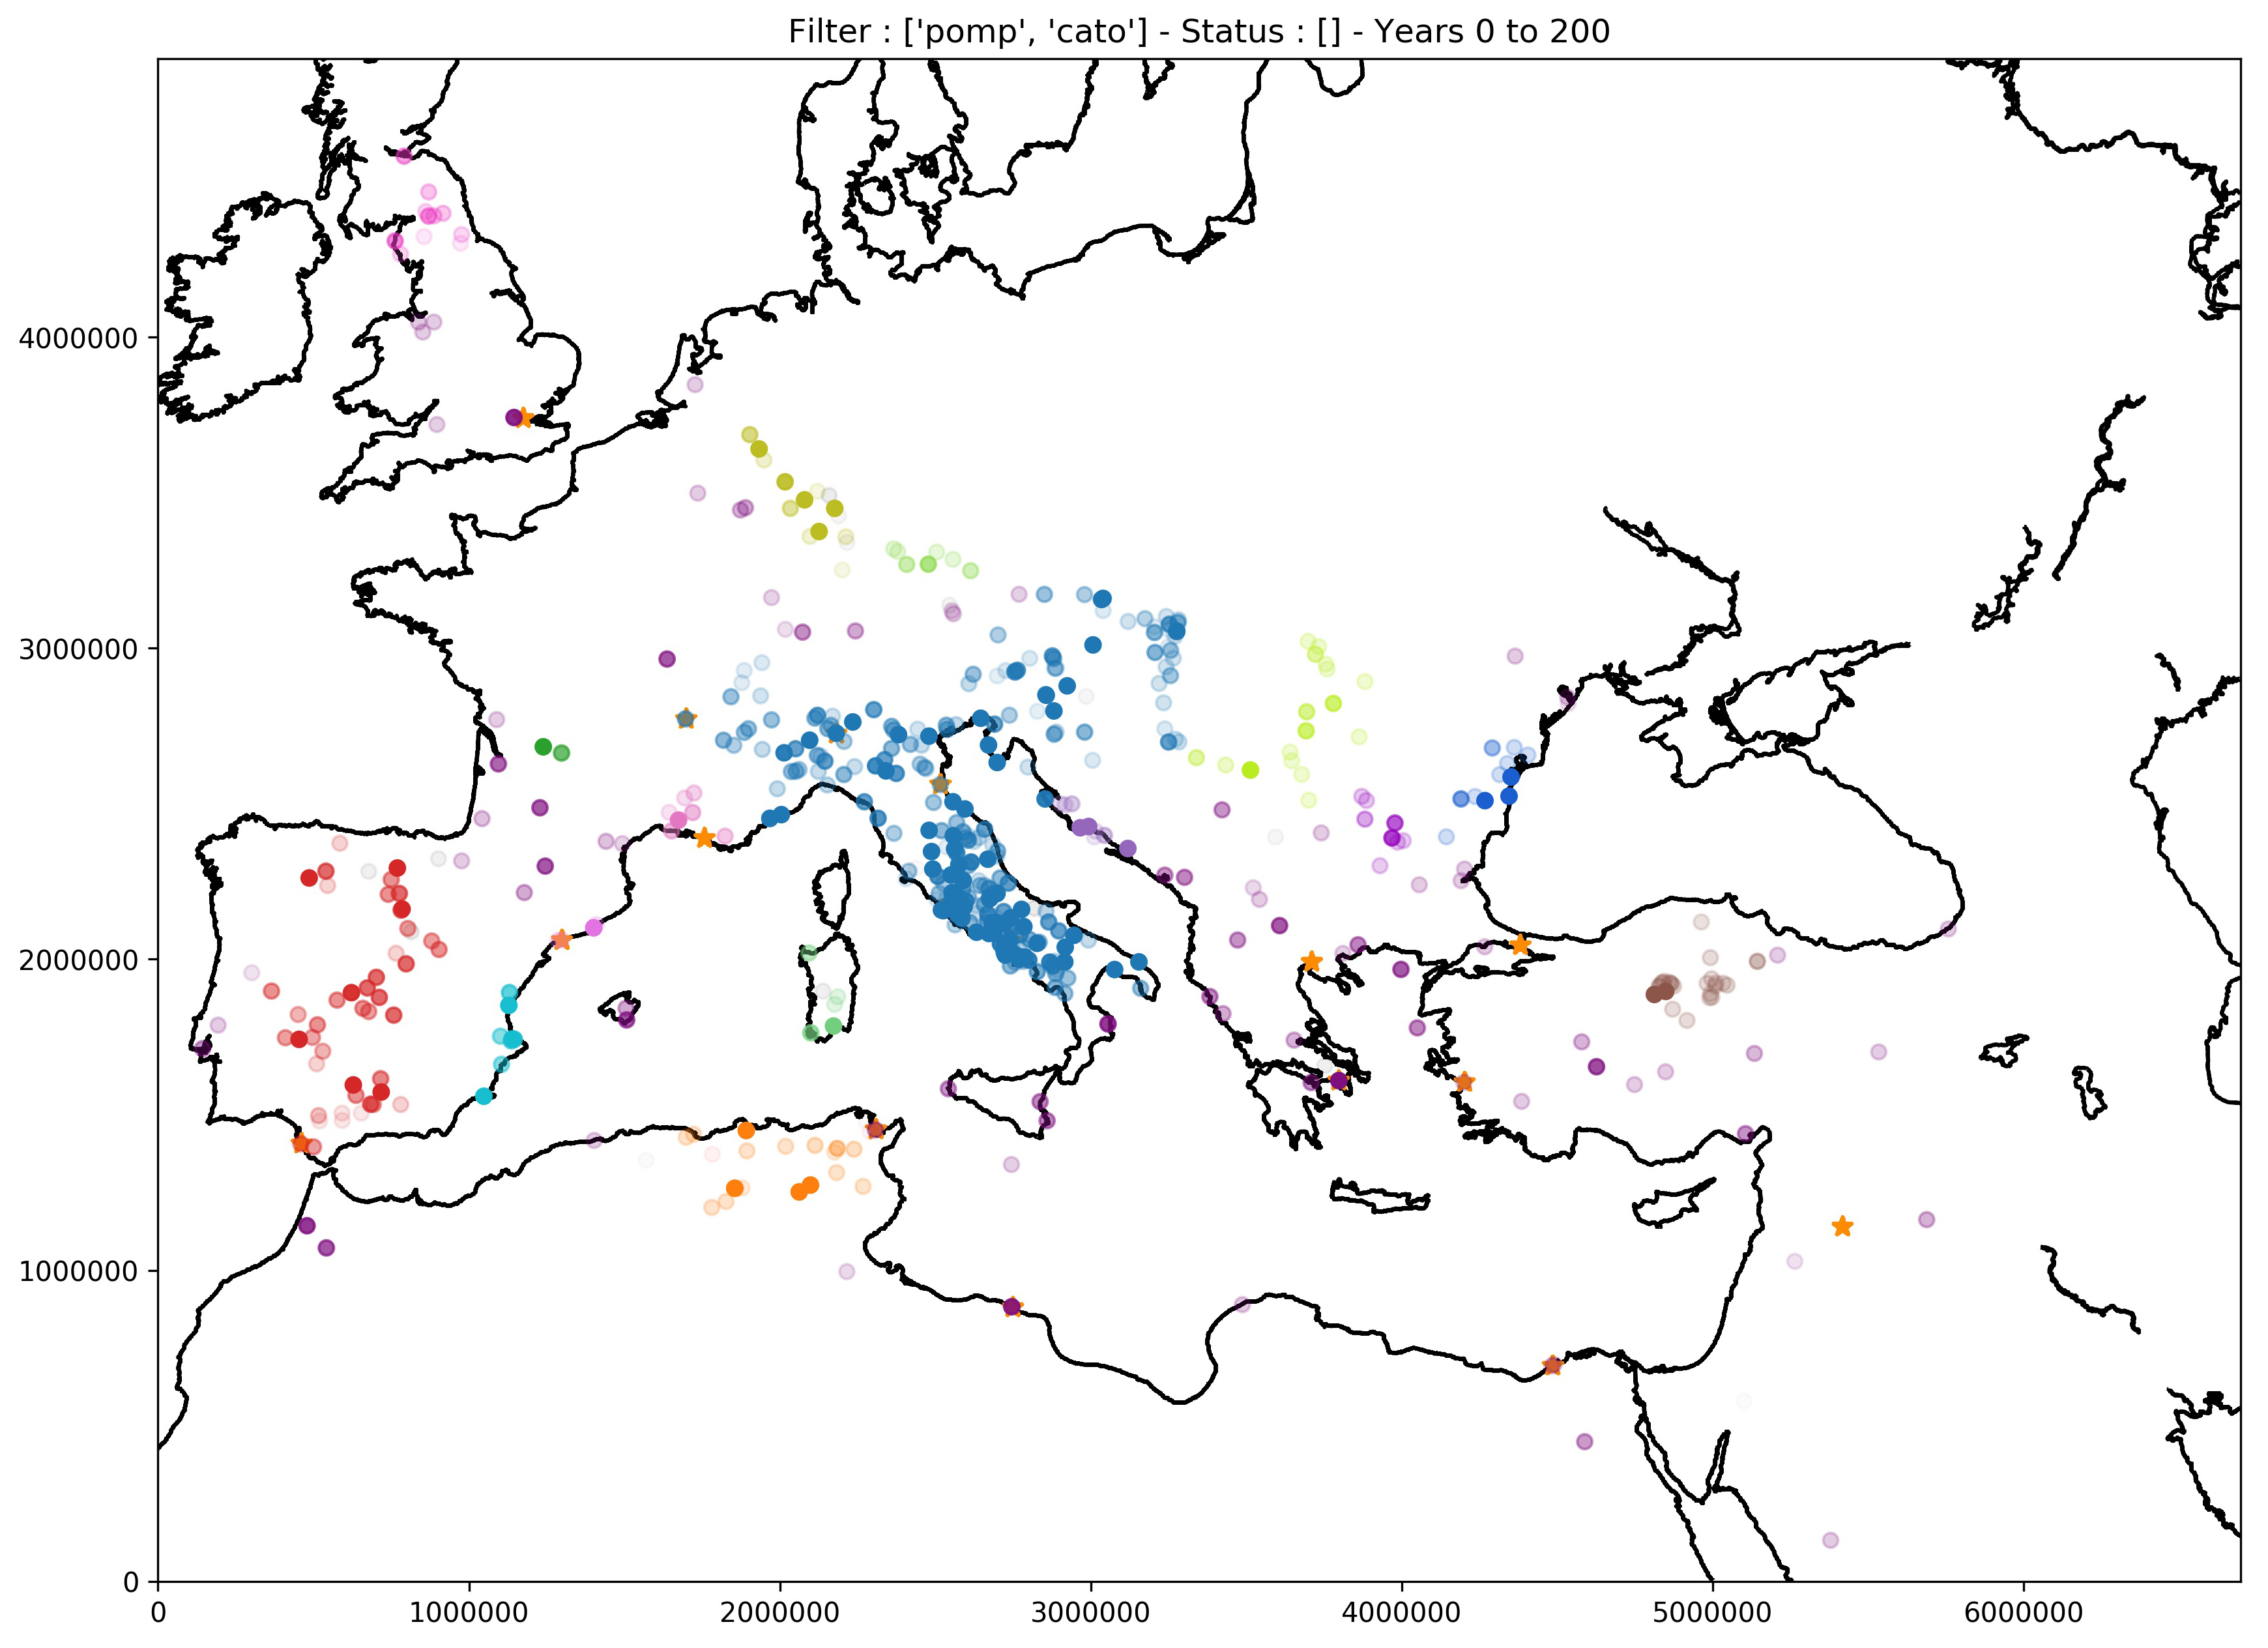
Pinpoint on a map

alt text

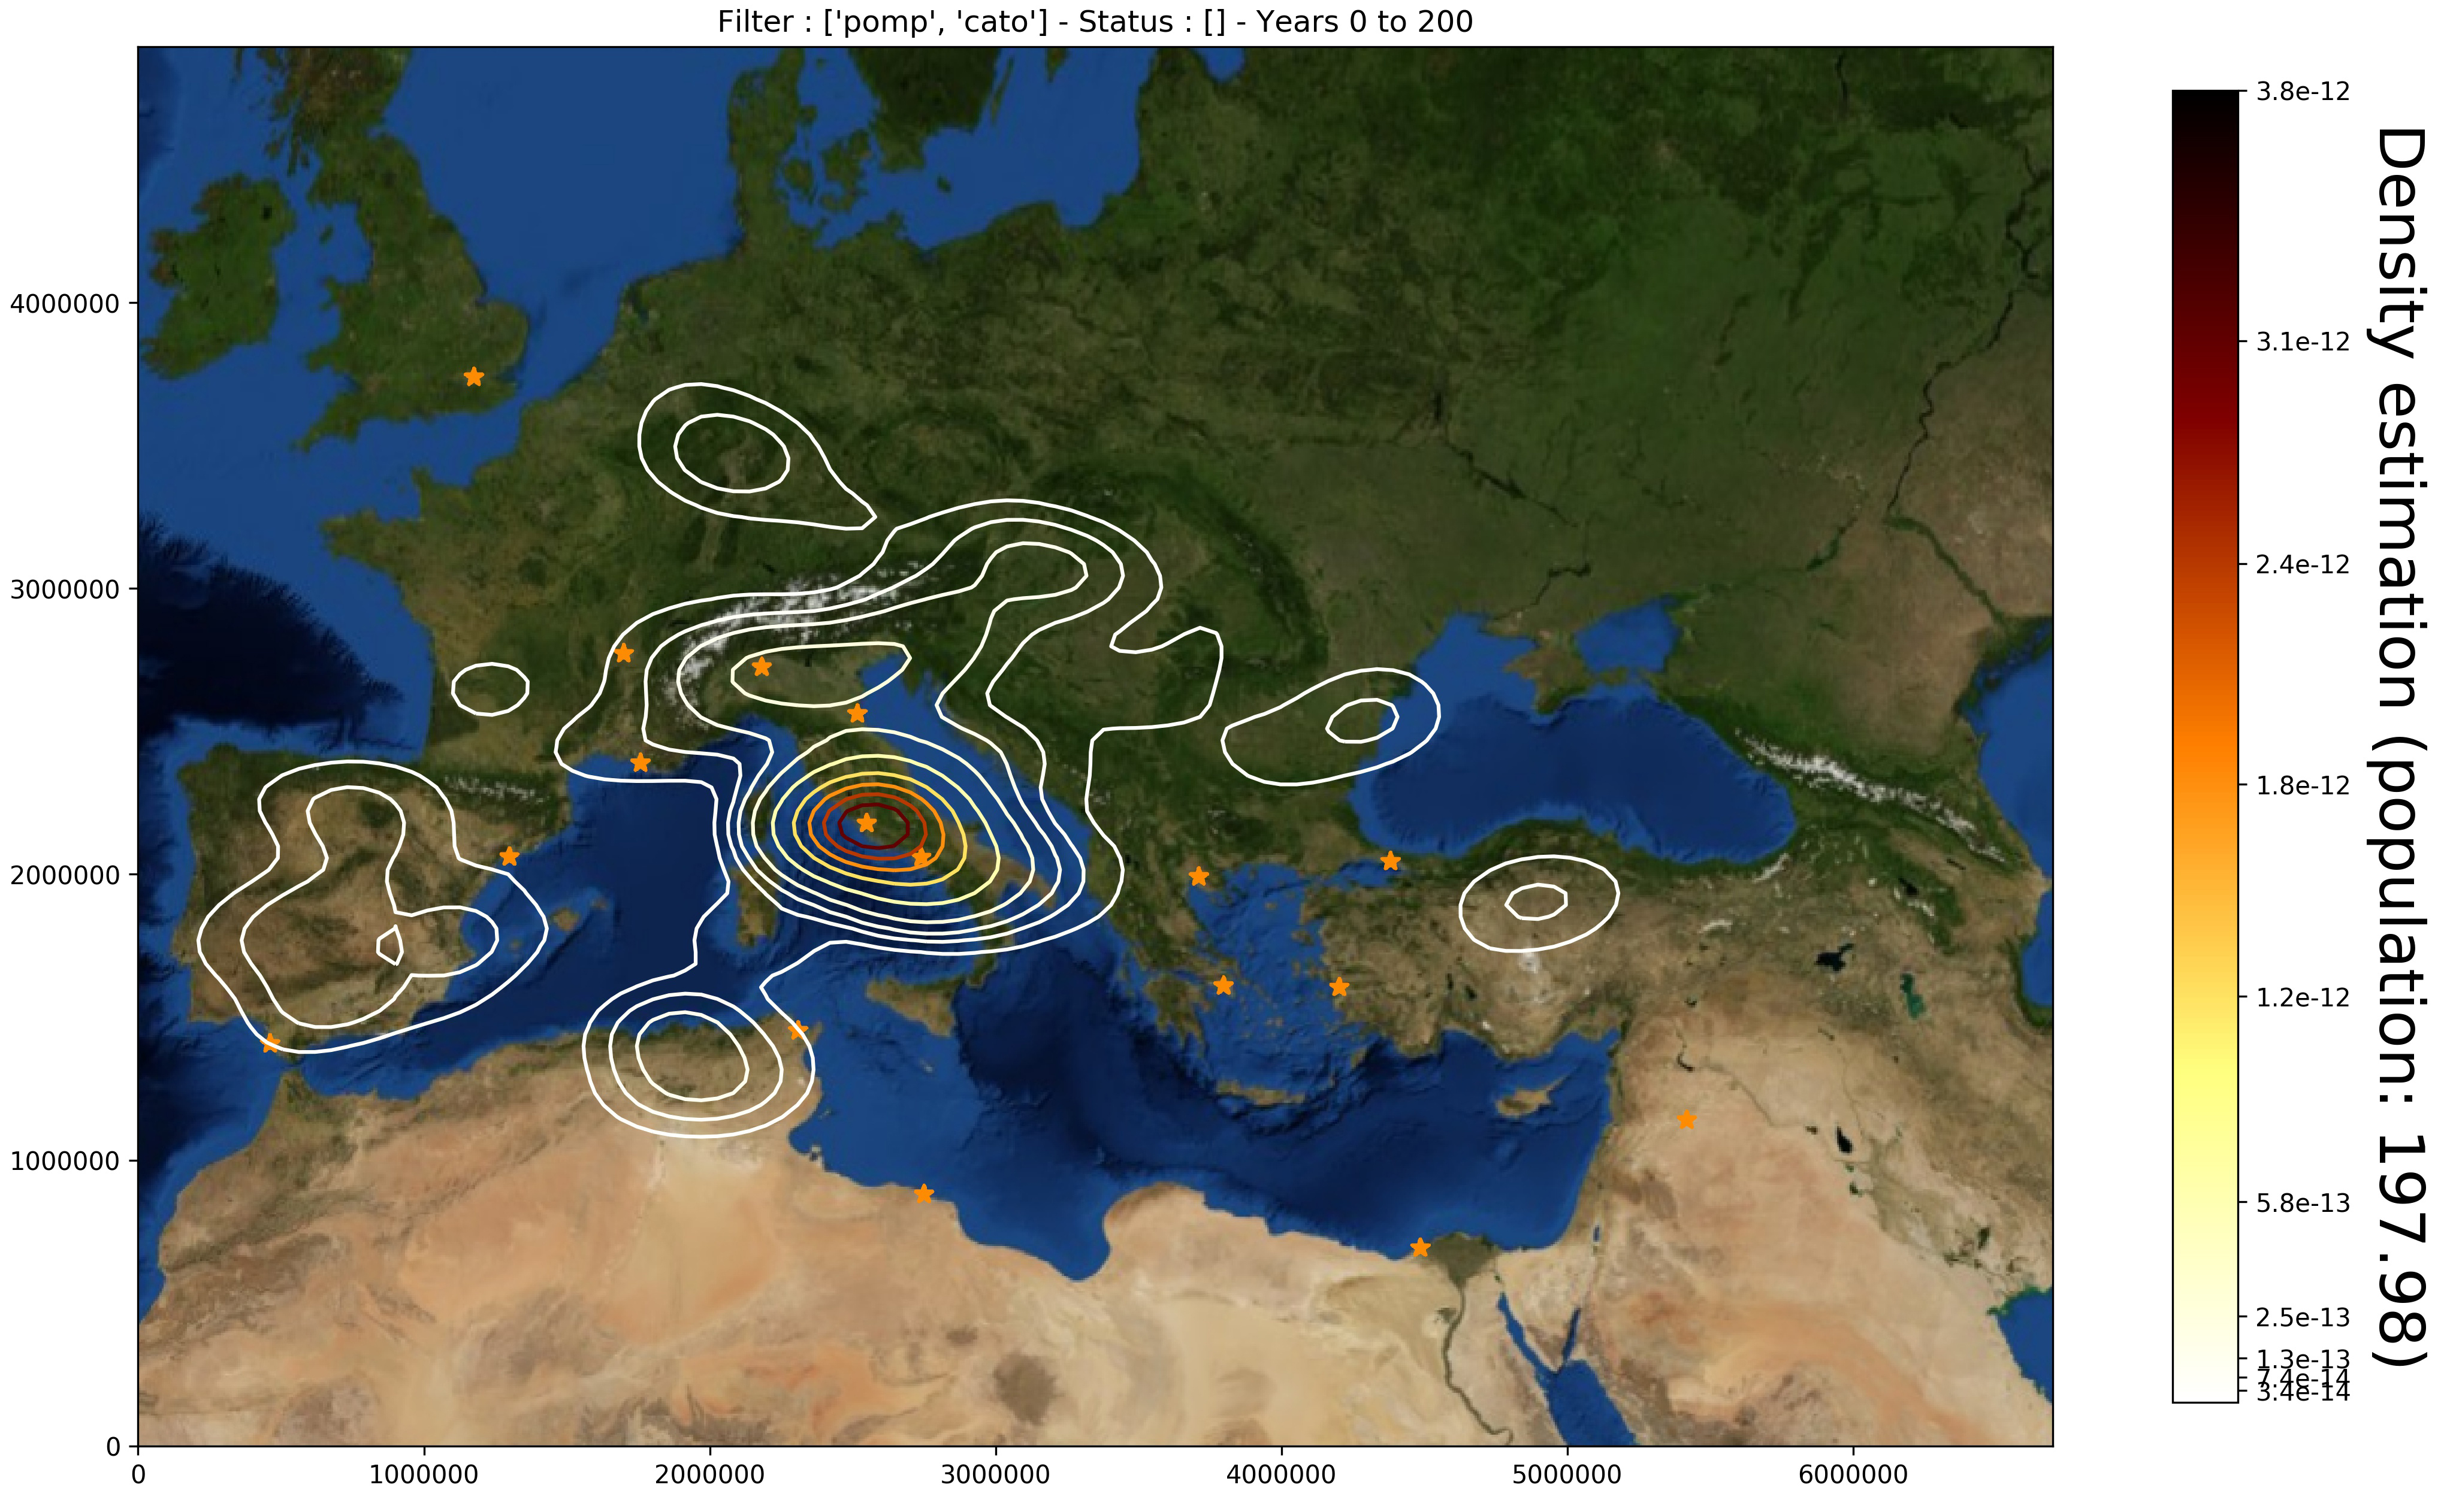
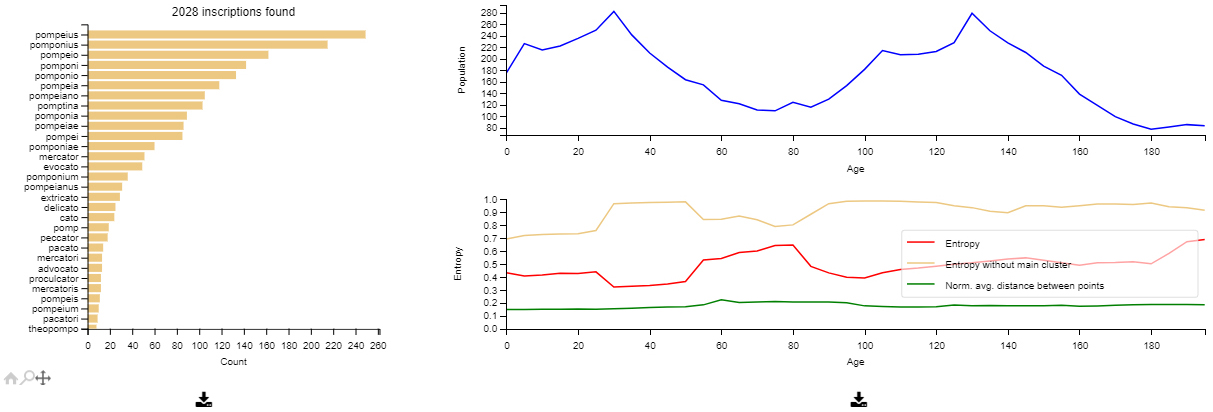
Explore various visualizations

alt text

Metrics provided

alt text

Make animated visualizations

(see how the limes appears around 100AC)